A problem many ecommerce websites encounter is inaccurately reported transaction and revenue figures. This happens for a number of reasons and if you do find duplicate recordings in your data, then you will need to troubleshoot the issue with your developer.
This step-by-step guide will show you how to create a custom report to identify duplicate transactions, understand the scale of the problem and also give clues on how to troubleshoot it.
If you are looking for a shortcut then just download and import our build of this Duplicate Transactions custom report.
If you want to know how to actually build one yourself then continue reading below…
Creating a New Custom Report
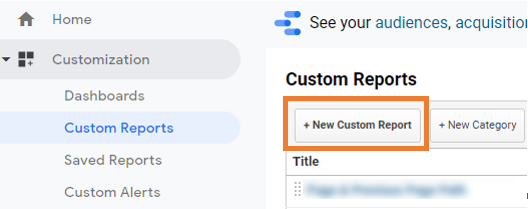
Navigate to Customization > Custom Reports and the click on the button to create a new custom report. Set it as an “Explorer” type report. Explorer reports allow you to set secondary dimensions – very useful for troubleshooting the problem later on.
Give your report an appropriate name.
Then select all the Metrics and Dimensions needed to build the report.
Transactions is the key metric that we are most concerned with – Revenue and Avg. Order Value are also useful to show us the severity of the issue (if one exists).
The primary dimension required is Transaction ID, you can also add Date and a drill down dimension.

Now save and view your new custom report.
Add an Advanced Filter
The next step is to create a filtering rule so only duplicate transactions appear in the report. ‘Include Transactions Greater than 1′ will do this.

Apply the filter and take a look at the report to see if you have any duplicates.
How to Use this Report
All results in the table show Transaction ID’s that have been recorded more than once, by definition a transaction ID should be unique for every purchase, so seeing more than one purchase with the same ID is the sign of an issue.
Revenue and the Average Order Value of the transaction indicate how much your revenue stats are off.
The percentage total highlighted in the screenshot below gives an idea of the effect the duplicate transactions are having on your total transaction data.
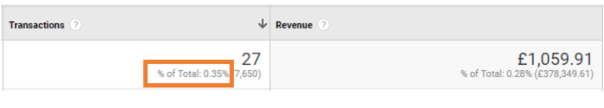
The number of rows represents the exact number of IDs. Use this figure to calculate what percentage of transaction ID’s are duplicated.

In this example, 0.17% of transaction’s were affected.
You could also add a secondary dimension at this point to see such things as what devices, browsers and marketing channels these duplicated transactions have been appearing under. This gives useful insight because often we find the issue is related to the checkout confirmation page misbehaving in a particular browser or device, thus giving some clues to the developer on how to fix it.
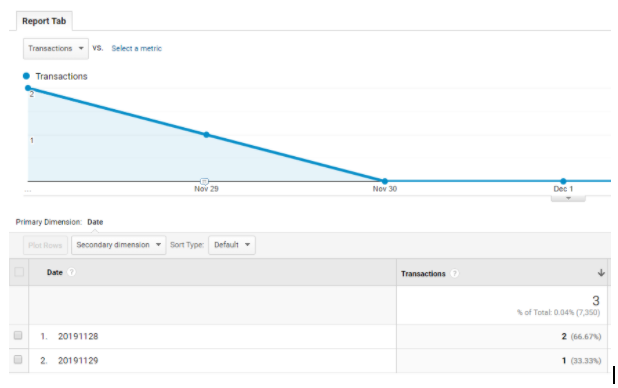
To dive in to this a bit further we can drill down to see if both the transactions occurred at the same time of if there was a delay between when they were recorded, which is also invaluable information for the site developer. The graph at the top of the explorer view still shows all transactions, but by drilling down into each transaction ID, the graph will be plotted to show the dates of each individual transaction.
Play around with it some more and include other useful dimensions and metrics.
Now that you know the extent of the problem, check out our post ‘Blocking Google Analytics Duplicate Transactions Using Google Tag Manager‘, to learn why this may be happening and how to stop sending duplicate transaction data using GTM.