Annotations in Google Analytics are an incredibly useful feature, they will help you understand spikes in traffic, trends and unusual changes.
So simple and powerful, but often forgotten, they will make analysing your reports for performance and anomalies much easier!
Why use Google Analytics Annotations?
It can be difficult to remember when you or a member of your team launched a particular email or paid traffic campaign, sending a ton of traffic to your site for a special promotion. Or when you launched a new site design or feature. In some cases these sorts of events will have a fundamental impact on your data.
Annotations let you put a marker, that appears on every graph in Google Analytics, for any specific date. Viola, problem solved!
Also, it is best practice to include these annotations/notes when working on an external clients account.
Your client may not be aware of the impact that your work will have when you begin and will be able to easily see it at a later point in time.
Here is an example from a large online retailer, where we can see a massive spike in revenue that coincides with a spike in email traffic. If you look below the peak there is a little annotation icon.
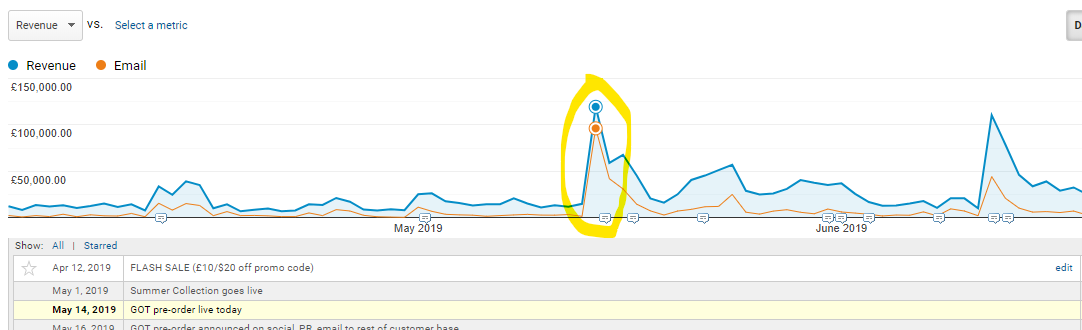
Clicking on it will reveal any notes associated with that date – which shows that an email campaign was sent out on May 14th informing subscribers that they can pre-order a new product.
Other example use cases could be massive spike in Google Analytics for a campaign or a trough for when the site server crashed or a migration occurred.
If you have made notes about all these events or have a record in your Email Service Provider or Ads campaign manager then you could go back and cross-reference. Although more often than not this will involve quite a bit of detection work and you won’t know where to look.
This is where Google Analytics annotations are massively valuable. If you and your team have been using the feature to its full advantage you will have a log of all relevant marketing, server, Analytics and Tag Manager events linked to the dates of occurrence.
With this you are armed with the wider context when performing data analysis – especially when you are looking at historic data from the previous month or year!
You can create private annotations which are only visible when you are logged in or you can also created shared annotations that everyone who has access to the reporting View can see.
How to create Annotations in Google Analytics?
To create an annotation in Google Analytics:
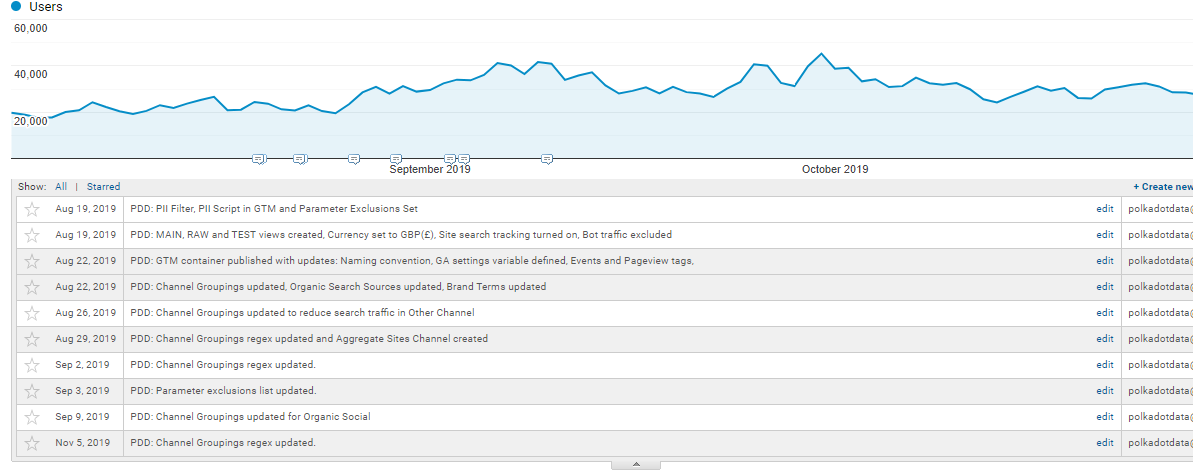
![]()
- Click the small tab below the timeline
- Click ‘+ Create new annotation’
- Select the date for the annotation
- Enter your note, and initial it
- Click ‘Save’.
It is possible to star important annotations, also each one is associated with the email address (login) that was used to create them. Annotations can be edited and deleted.
For best practice ensure you write a meaningful comment so that someone else on your team who was not directly involved with the activity will still understand its reference.
On that note, brief your whole team and also external agencies to add annotations and to initial them – especially if they login using shared email addresses.
When to use Annotations?
Here are some of the key use cases that we recommend to document in annotations…
- New paid traffic campaigns that your team and agencies have launched
- Email campaigns – (these often result in a short sharp spike in traffic if the list is responsive)
- Offline advertising, especially TV or any media reaching a large audience
- Major website changes – (including launching a new website, theme or adding lots of new content)
- Changes to Analytics filters, Channel Groupings and anything that will effect the data
- Major changes to your Google Tag Manager container
- Digital advertising campaigns, including search, display and social
- Website problems, including server issues
- Key calendar events such as Black Friday, Boxing Day, etc.
Limitations
Unfortunately you cannot export annotations, so if you often export your reports to share with clients and managers they won’t be able to see the detailed notes. Although – if exporting via PDF then the comment icon does appear on the graph without the actual text.
Also, there is no way to blanket out periods over a custom date range. The annotation only appears on the one date you entered whitest creating it. You could always create another annotation to signify the end of an event if it makes sense to do so, (e.g. turning off a paid Facebook campaign).
Start this Good Habit Today…
In summary, adding annotations to your reporting view will give you a very good foundation for deciphering anomalies and analysing campaign performance.
It is difficult to remember all the site and filter changes you made and the dates they were published for just yourself, let alone when you have a big team across different departments and agencies all responsible for web activities!
I hope you can see how it is much easier to identify trends and perform analysis with these sorts of events well documented in Google Analytics.
We have made it standard practice in our team across all of our own accounts as well as our clients accounts to record annotations and they are an invaluable tool for us.
If you would like to know more, or have us audit your current Analytics set up, get in touch today.