In today’s digital age, data reigns supreme. For businesses striving to stay ahead in the competitive landscape, understanding user behaviour and leveraging insights is crucial. Google Analytics 4 (GA4) presents a powerful toolset for precisely this purpose. However, many users find themselves overwhelmed by its interface, unsure of how to navigate its features effectively.
In our previous blog, we discussed ‘How to get value from GA4?‘. In this guide, we’ll walk you through how to make the GA4 interface work for you, unlocking its full potential to drive informed decision-making and enhance your online presence.
Understanding the GA4 Interface
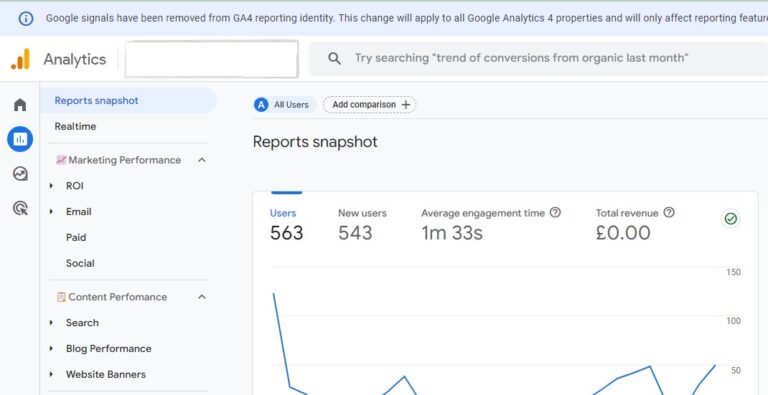
First things first, let’s get acquainted with the GA4 interface. Upon logging in, you’ll encounter a dashboard comprised of various tabs and sections, each offering unique insights into your website or app’s performance. The primary components include:
Home: Your starting point, offering an overview of key metrics and trends.
Reports: Dive deeper into specific analytics reports, such as audience, acquisition, behaviour, and conversions.
Realtime: Monitor live user activity on your site or app.
Exploration: Analyse data using customizable exploratory techniques.
Events: Track user interactions and events across your digital properties.
Engagement: Understand user engagement with your content.
Retention: Assess user retention and churn rates.
Monetization: If applicable, analyse revenue and transactions.
Conversions: Track conversion events and their performance.
Customising Your Dashboard
One of the most powerful features of GA4 is its flexibility in customisation. Tailoring your dashboard to display the metrics most relevant to your business objectives can significantly enhance your workflow. Here’s how to do it:
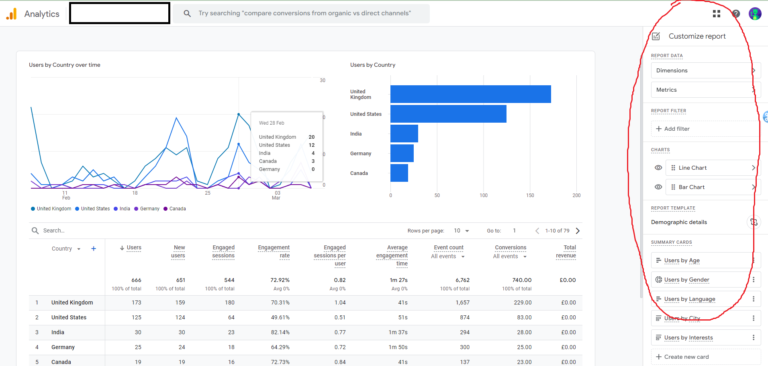
Add Widgets: Click on the “Customise Dashboard” button to add widgets displaying metrics of your choice, such as sessions, pageviews, conversion rate, etc.
Arrange Widgets: Drag and drop widgets to arrange them according to your preference.
Apply Filters: Utilise filters to focus on specific segments of your audience, such as demographics, geography, or behaviour.
Once you have finished customising your report, click ‘Save. ‘Save changes to current report’ will update this in the interface. Clicking ‘Save as a new report’ will allow you to rename the report – this will then get saved in your Library collection.
Managing Your Library
Google Analytics 4 (GA4) introduces a powerful feature called the Library, which is a where all your most valued and custom reports are stored. Leveraging the Library can streamline your analytics setup and enhance efficiency. Here’s a short guide on how to make the most of this valuable tool:
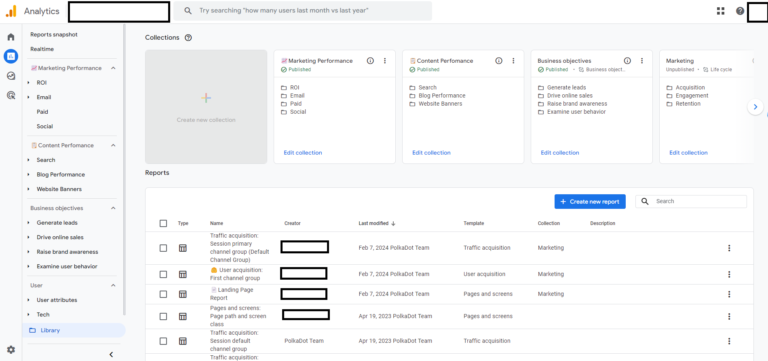
Accessing the Library:
Navigate to the Reports section of your GA4 Property
In the bottom left hand corner, you will see ‘Library’.
This will then open up all your reports and sections including the one you saved earlier!
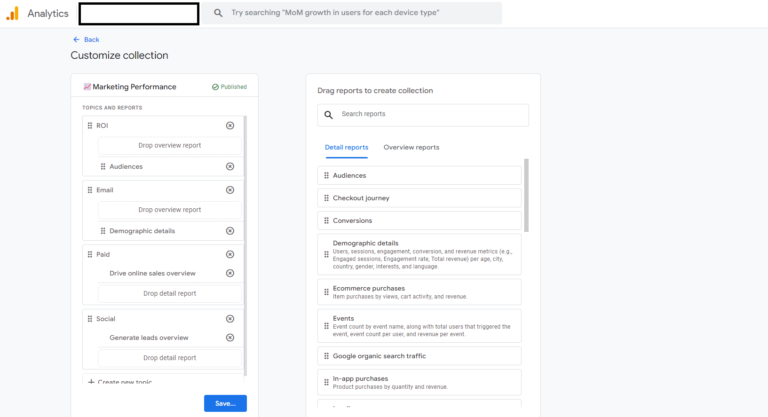
Editing Collections
Along the top section, you will see the collections. Those that are ‘Published’ with a green tick, mean they will be the reports that show in the main reports section of the interface when you open GA4 each time.
Hit ‘Edit Collection’ – this will take you inside the collection made up of your reports. Here you can find all your reports and are able to drag and drop them into your collection on the left.
Once you are happy with the reports in your new collection and have renamed them to suit, hit the ‘Save’ button.
Upon, returning to the library, make sure your new collection is published and you’re good to go. Do this as many times to suit and you can create the perfect set up to review your analytics relevant and valuable to you.
By mastering the Library in Google Analytics 4, you can optimize your analytics setup, streamline workflows, and unlock valuable insights to drive informed decision-making. Explore its capabilities, experiment with configurations, and reap the benefits of enhanced efficiency and data accuracy.
As always we’re here to help so do contact us if you need any support.